Making factory quality data effortless to read
heqs is a quality-management platform for manufacturers. I led the product design of its Statistics & Analytics — turning dense production data into clear, decision-ready dashboards.
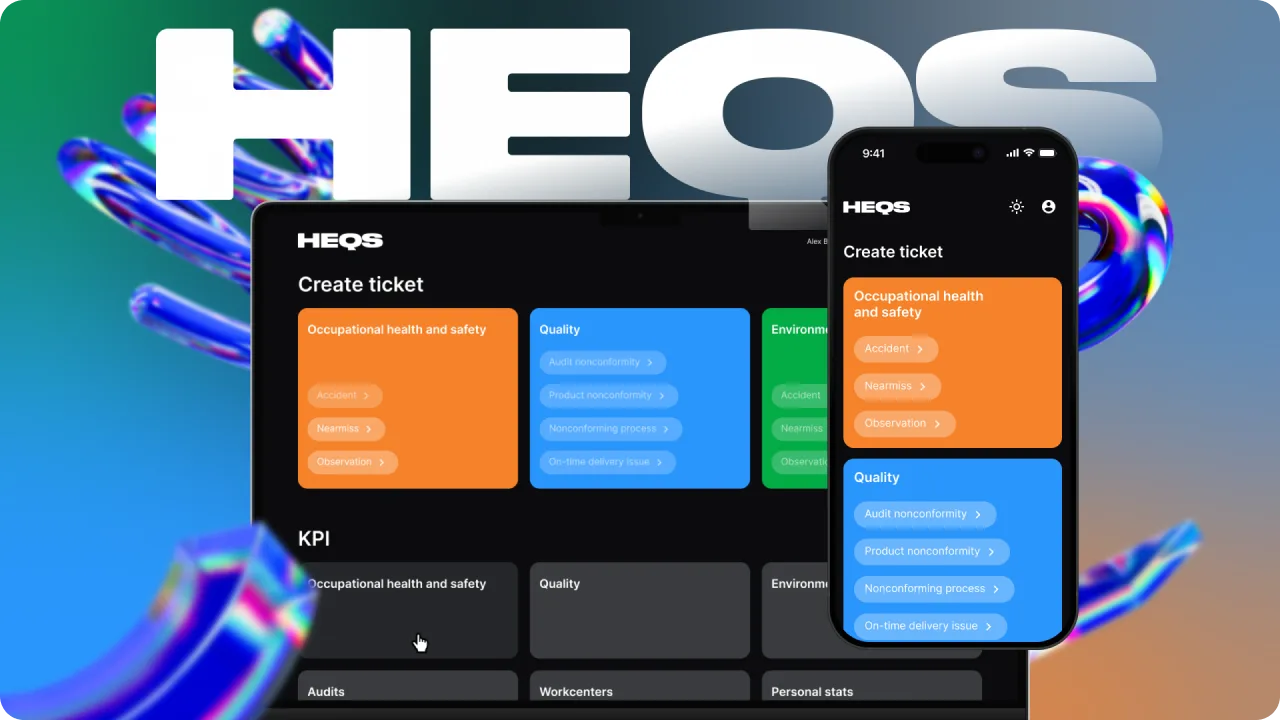
Overview
What is heqs?
heqs is an IT platform that automates quality management for manufacturers — lifting business efficiency with reliable production statistics.
It helps factories raise process quality, cut waste and prevent accidents — across facilities worldwide.
- To register a nonconformity
- < 1 min
- KPIs & loss tracking
- Real-time
- One connected system
- Web + Mobile
My role
I'm a Product Designer on the heqs team. I led Statistics & Analytics end to end: the chart system, every dashboard and its data states, where my data-viz expertise ran deepest. Beyond that, I shaped the rest of the product alongside two other designers.
- Dashboards & KPIs — information hierarchy tuned for managers scanning fast.
- A chart-type system — Marimekko, donut, stacked and YoY bars — each chosen per question.
- Every data state — empty, half-empty and full states designed for each view.
- Dark-theme data viz — a legible, accessible colour system for charts on dark UI.
Mobile
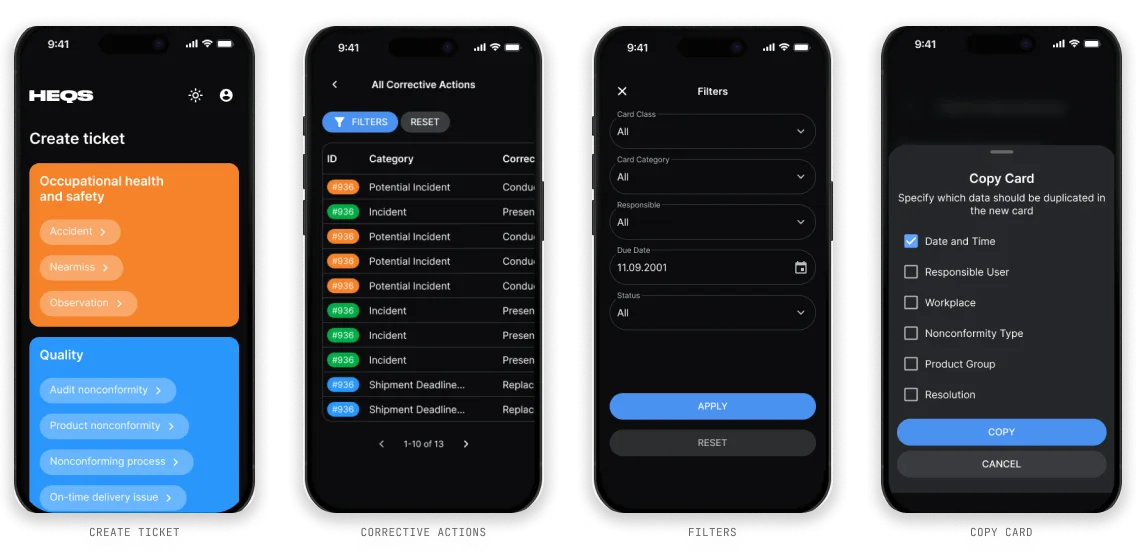
Quality, in everyone’s pocket
On the shop floor, operators log a nonconformity in under a minute — the same data that feeds the analytics.
Statistics & Analytics
The analytics, end to end
The part of heqs I owned. Managers open it to answer one question fast: where are we losing quality, and why? Everything flows from headline KPIs down to root-cause detail.
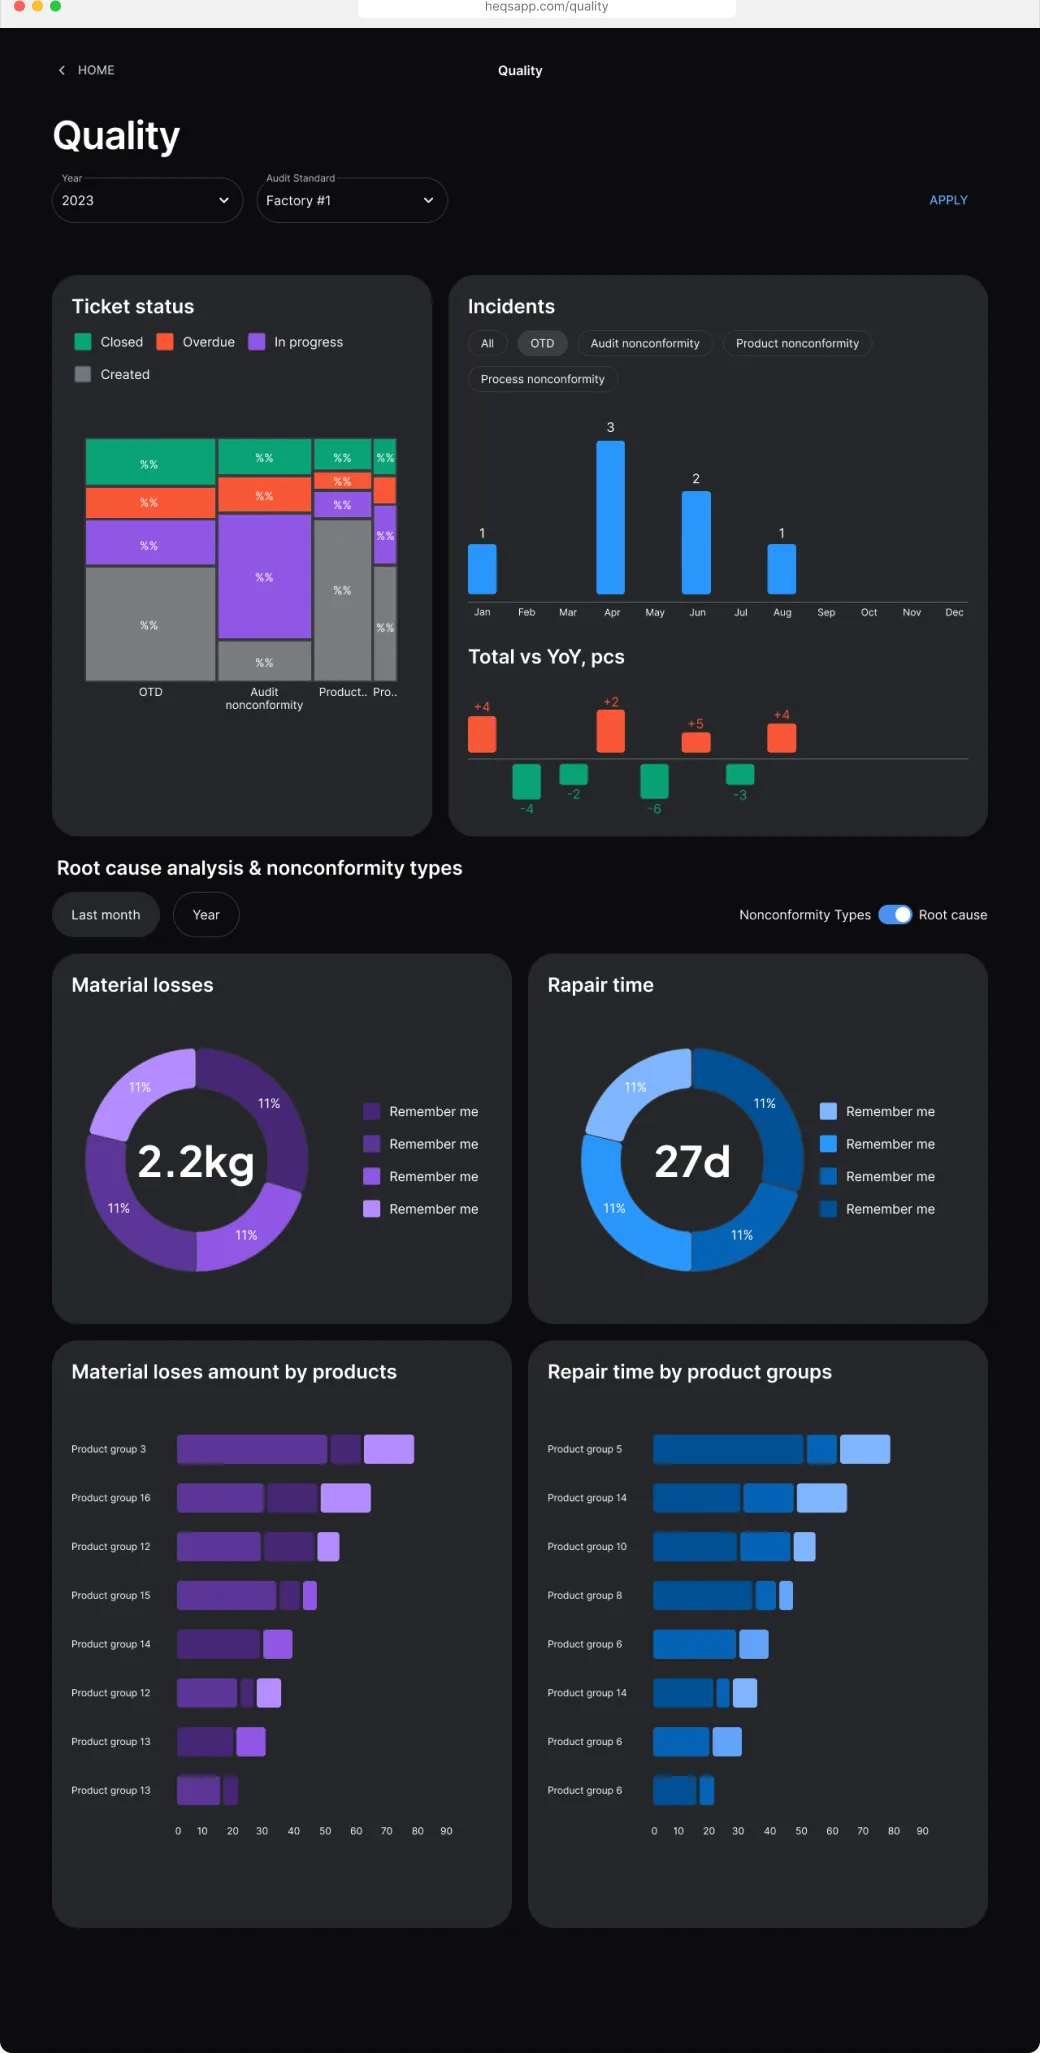
- Status · Marimekko — share and volume in one chart, split by nonconformity class.
- Ratios · Donuts — material losses (2.2 kg) and repair time (27 d) read in a glance.
- Comparison · Bars & YoY — totals against year-over-year delta, color-coded up and down.
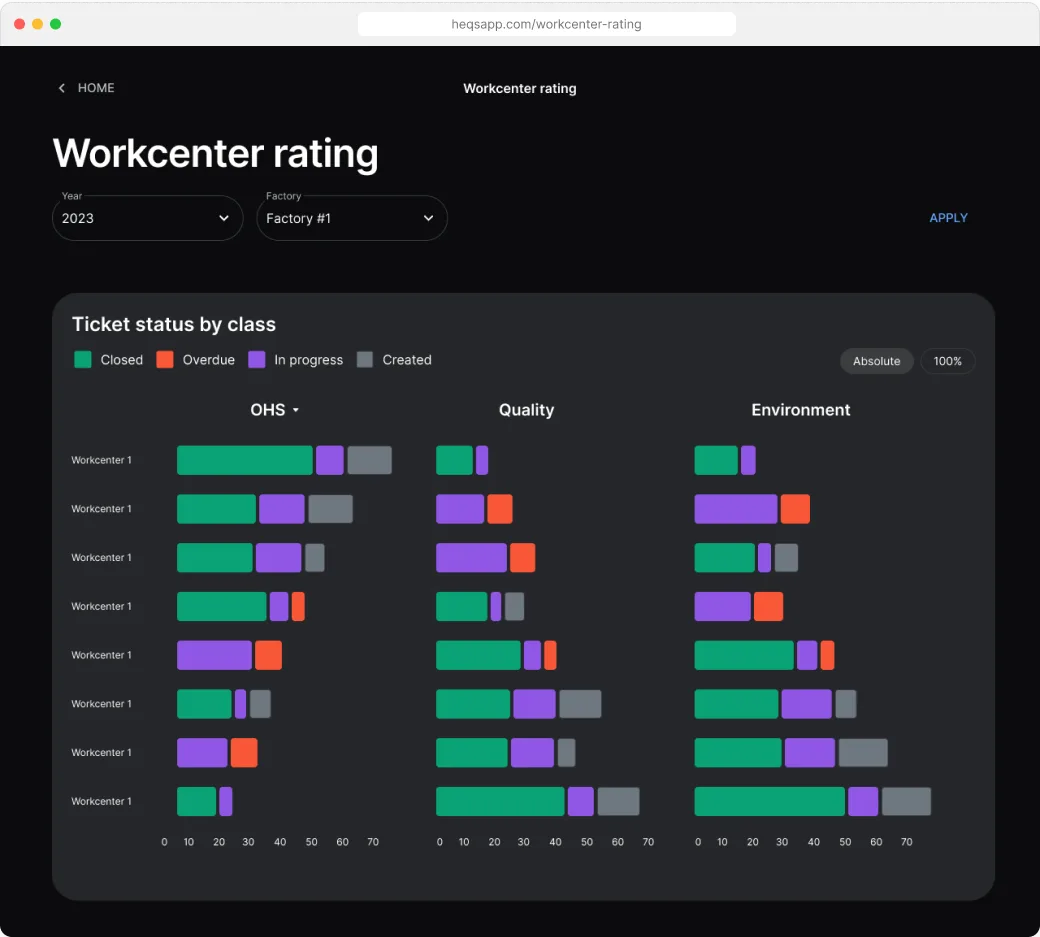
Beyond the dashboards
The product, screen by screen
A quick pass through heqs — from creating a ticket to its full detail and the workflow around it.