Overview
Alchemist automates the migration of legacy SAS codebases to Apache Spark for enterprise data teams. The product spans four surfaces — brand, marketing site, customer portal, and analytics — designed as one coherent system, with the data layer built in code.
- Brand & Identity — logo, visual language and a colour system built on an alchemy metaphor. Solo — brand & UI.
- Marketing Site — getalchemist.io — positioning a complex enterprise tool for technical buyers. Solo · Webflow + custom code.
- Customer Portal — onboarding, licensing, downloads and user management for migrations. Solo design · with a dev.
- Analytics Dashboard — customisable migration insights teams arrange themselves. Design + front-end · React.
The challenge
Moving an enterprise off SAS can take years. The hardest part isn't writing new code — it's understanding what exists, proving the conversion is correct, and keeping every stakeholder oriented.
- An opaque estate — teams couldn't see what lived inside a legacy SAS codebase, or how far a migration had progressed.
- Manual and error-prone — conversion was hand-done and hard to trust — every edge case a fresh risk with no audit trail.
- No self-service — every status question and download routed through engineers, turning the team into a bottleneck.
Brand & identity
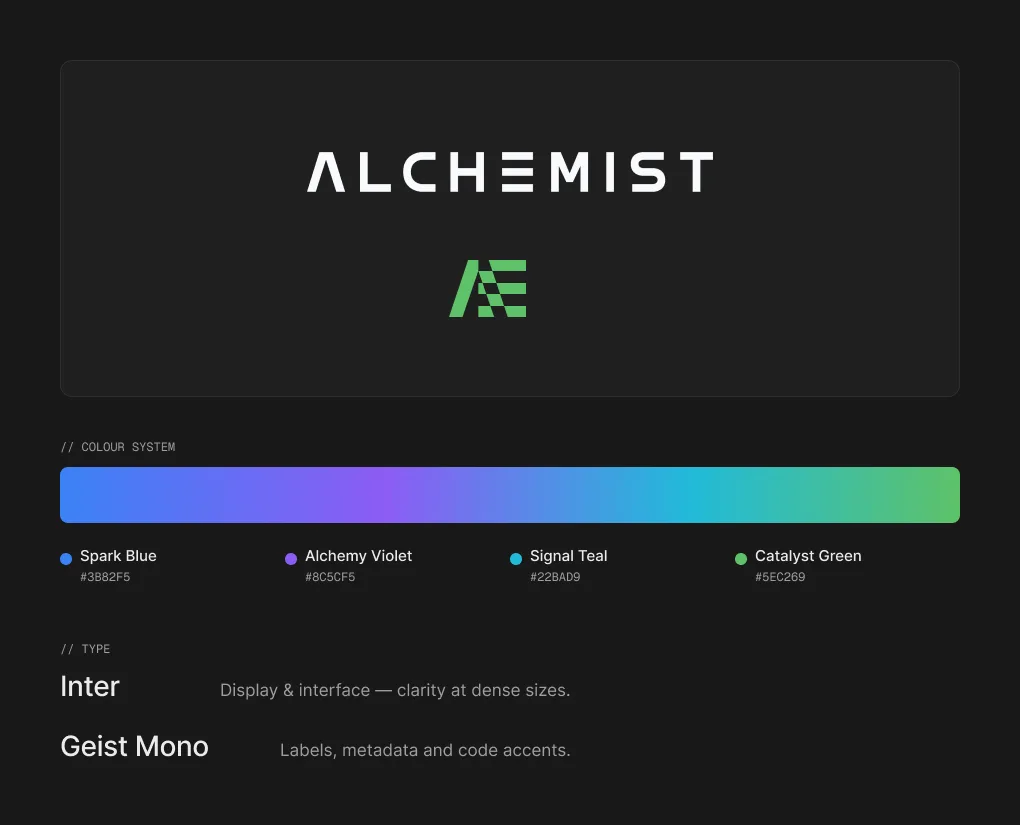
An identity built on transformation.
The metaphor. Alchemy turns base material into gold. Here, legacy SAS becomes modern Spark — the brand leans into transmutation, not just migration.
One mark, two forms. Used as a full lockup or a compact symbol — one at a time, never both — so the brand scales from favicon to hero.
Why dark. The product runs on a dark, technical canvas that keeps focus on dense data and long analytical sessions.
Marketing site
Selling a complex tool in a single scroll.
The site has one job: convince technical, skeptical enterprise buyers that an automated SAS→Spark migration is real — the narrative mirrors the product, Analyze then Convert.
Solo designer · Webflow + custom code · Live at getalchemist.io.
Customer portal
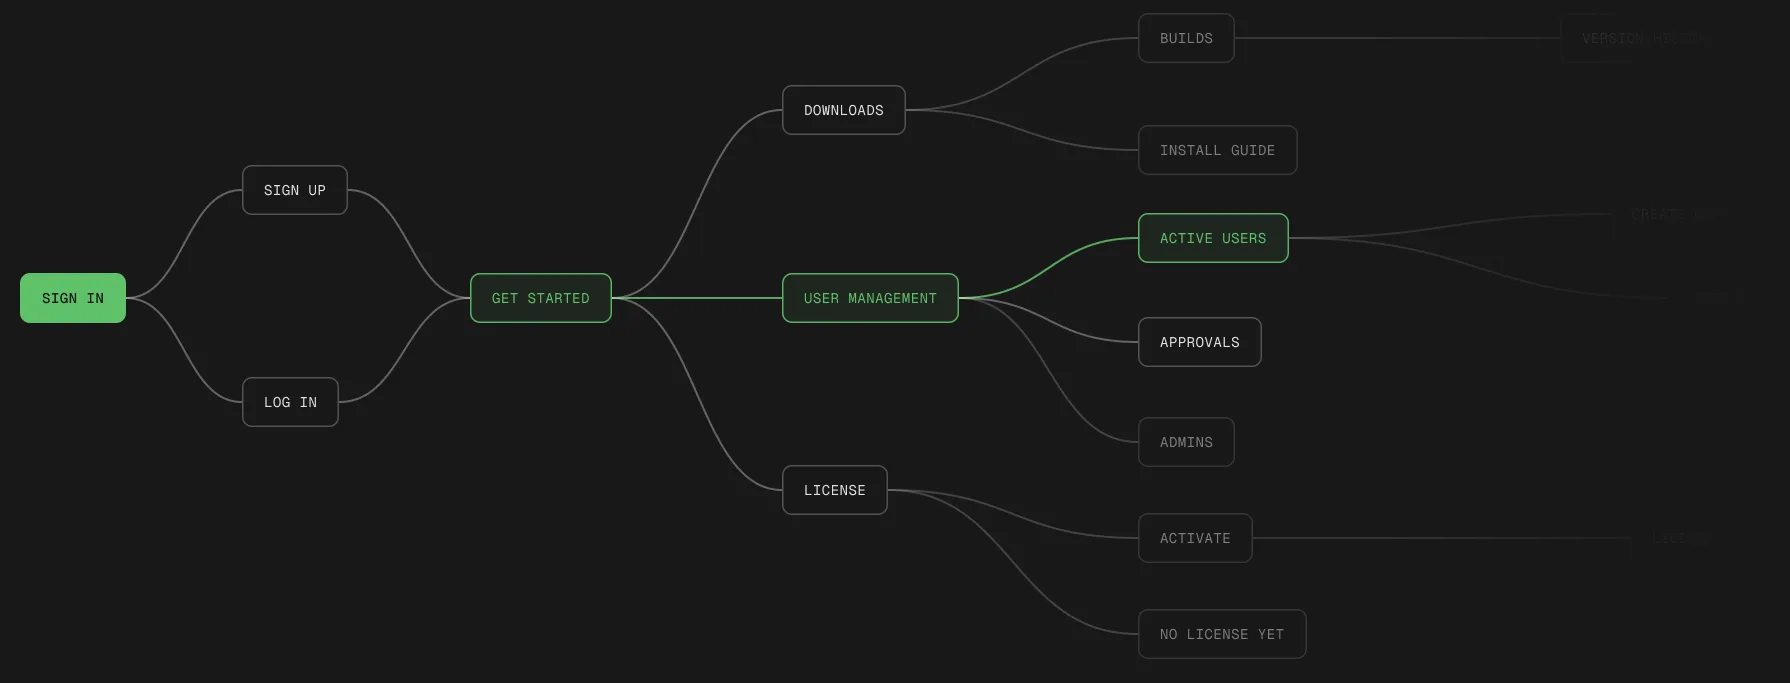
From chaos to a map you can follow.
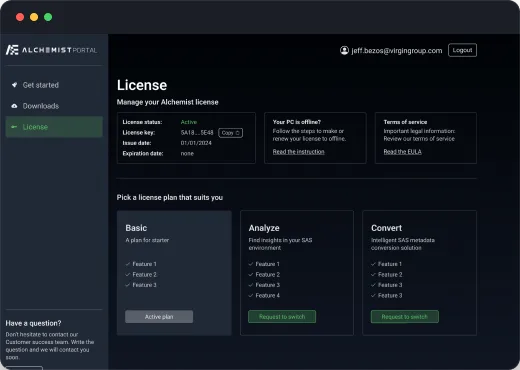
Mapping the portal's architecture established a clear, scalable structure — turning tangled, undefined flows into intuitive paths users can actually follow.
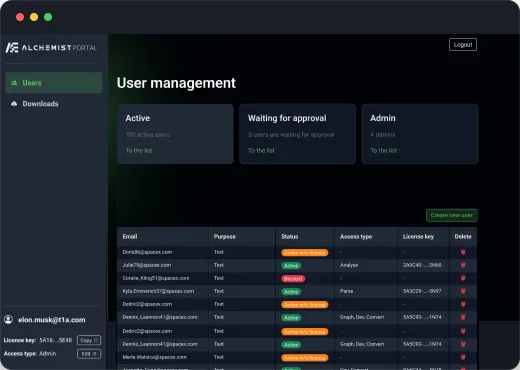
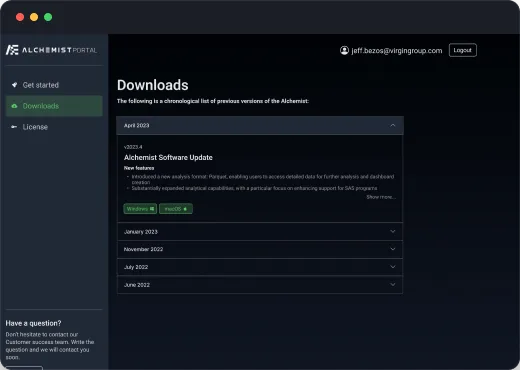
One dark system, every job in one place.
A consistent dark UI kit — sidebar navigation, KPI summary cards, dense data tables and status badges — reused across onboarding, user management, downloads and licensing.
Analytics dashboard
“We want to see everything at once — and to arrange the dashboard ourselves.” — the product brief, verbatim
Total visibility and total control pull in opposite directions. Resolving that tension drove every decision in the analytics layer.
Overview first. Detail on demand.
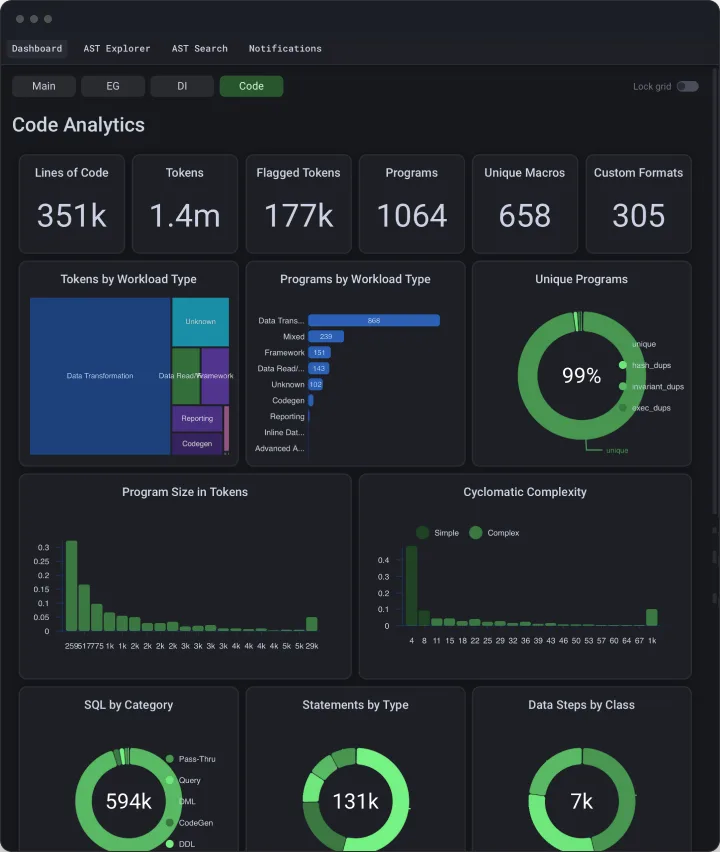
Dozens of metrics, one screen — without overwhelm. The layout descends from headline numbers to fine-grained drill-downs, so the eye finds scale first and specifics second.
- Headline KPIs — six top-line metrics frame the whole estate at a glance.
- Composition — donut charts show part-to-whole splits without reading numbers.
- Distribution — histograms and bar rankings compare magnitudes and outliers.
- Drill-downs — top-N tables surface the specifics only when you want them.
A dashboard each team arranges itself.
The hardest requirement — “see everything, and control it yourself” — became a customisable layer. Built with react-grid-layout, every widget is draggable and resizable, and each user's arrangement persists.
- Drag — reorder any widget freely.
- Resize — pull a corner to scale it.
- Persist — each team keeps its own view.
Design × build
Charts built in code, true to the design.
The analytics layer was designed and built as a single effort. Highcharts re-themed to the brand palette, real migration data wired in, and the customisable grid assembled in React — so the shipped product matched the design exactly, with no detail lost to a hand-off.
- React — components, state, and the customisable grid that holds every widget.
- Highcharts — every chart re-themed to the brand palette, on a dark canvas.
- react-grid-layout — the drag-and-resize system behind user-arranged dashboards.
What it adds up to
Design, all the way down to the code.
- One coherent system — from the logo to a live dashboard, every surface speaks one visual language.
- Legibility over density — tangled flows and walls of metrics were reshaped to be read at a glance, not decoded.
- Data-viz that ships — the data layer was delivered production-ready in code — not handed over as a static spec.