Introduction
A city that was never rewritten
Most building-age maps tell a story of demolition — the old washed out, the city rewriting itself. Wiesbaden tells the opposite story.
An imperial spa town, it was built in one generation: 872 of its 1,552 listed monuments went up between 1890 and 1910, when the Kaiser summered here and the spa boom paid for everything. The war took 22.3% of the housing stock — light, next to Frankfurt and Mainz across the river. So the peak of the 1960s–70s here is not reconstruction. It is a new city growing beside the surviving one.
The map colours all 55,251 buildings by the era they were built. What follows is a set of six plates: each one a single view of that data, with the key needed to read it and a note on what it shows.
The whole city
How to read
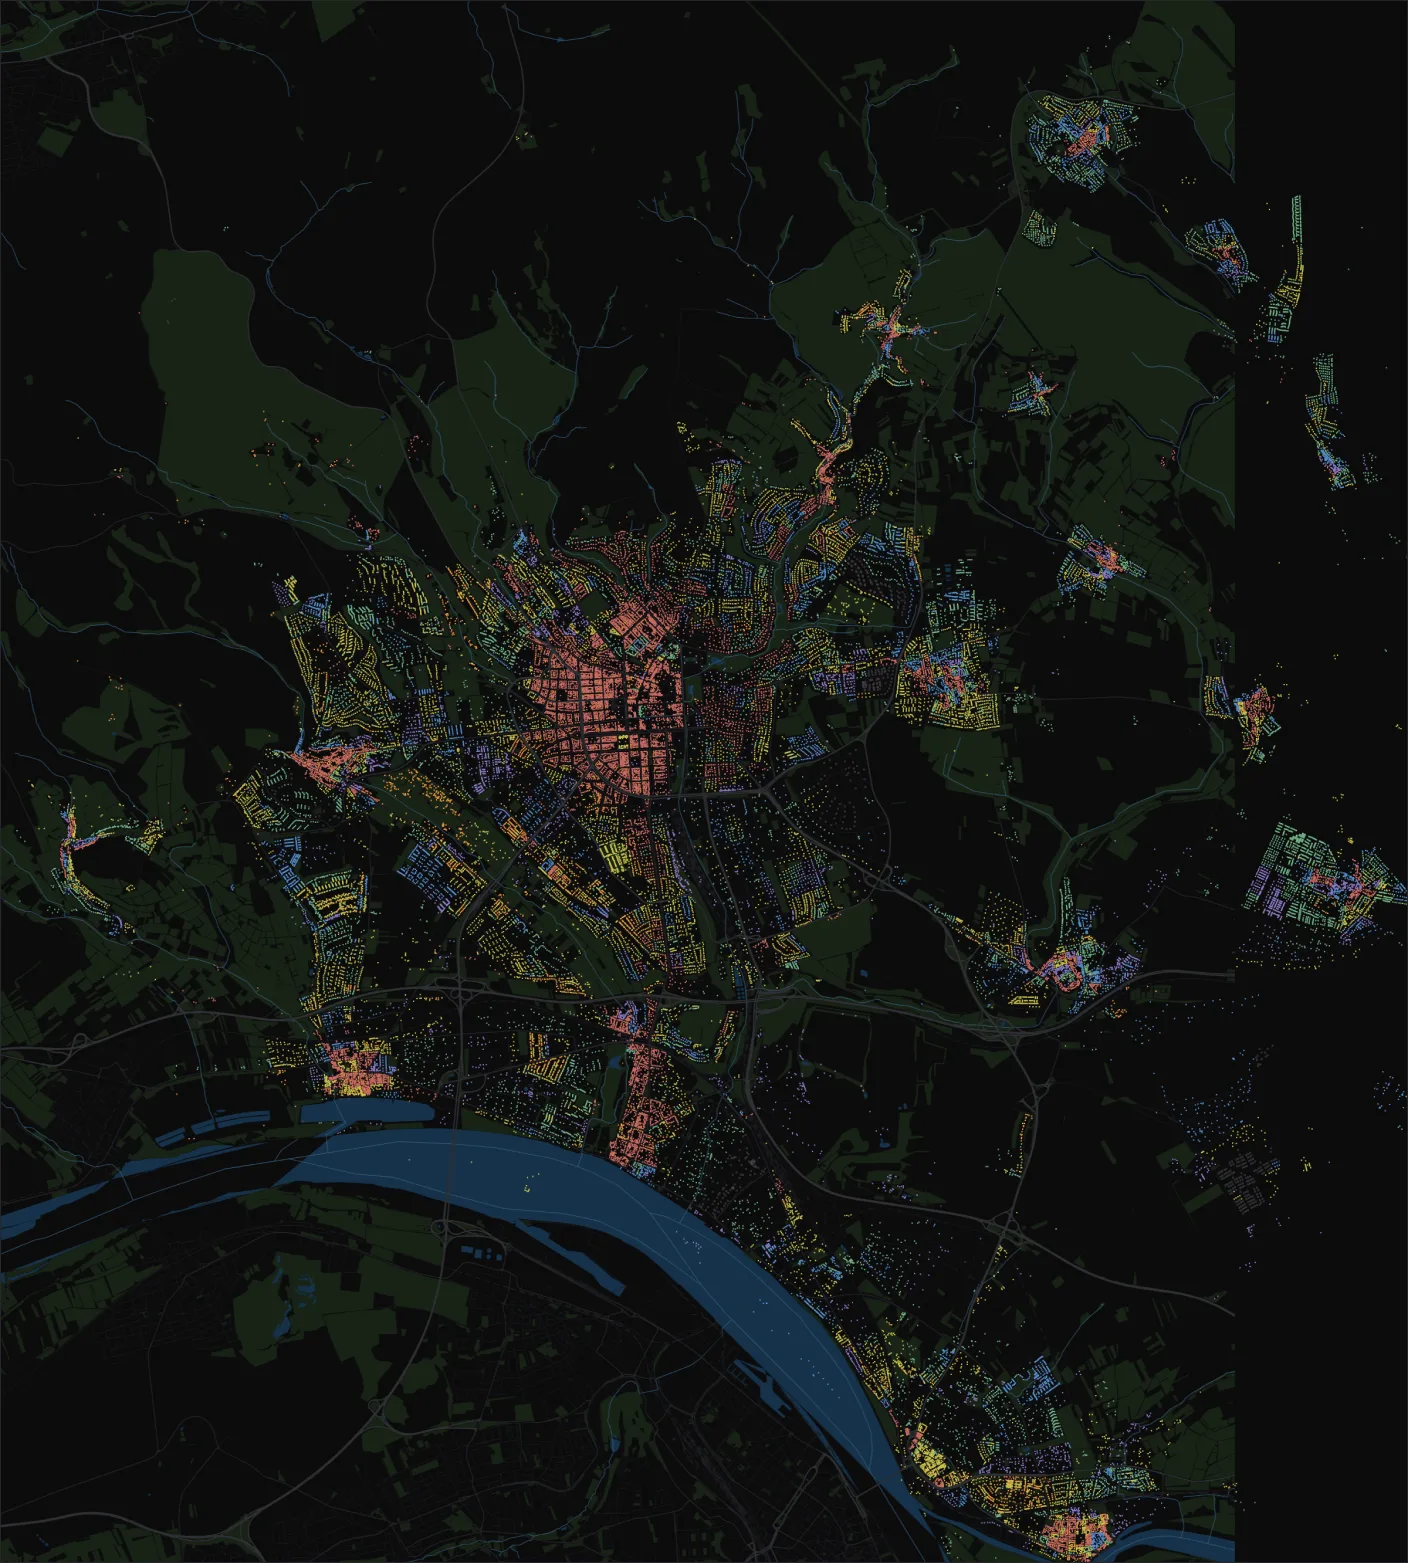
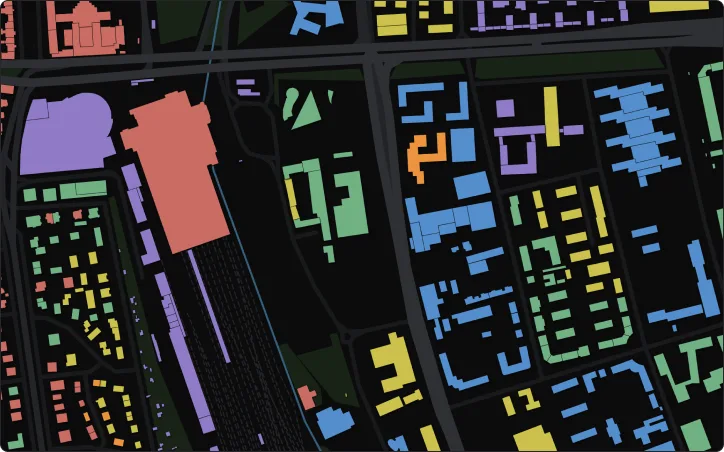
Each shape is one building. Its colour is the period it was built in — six bands running warm to cool across a century and a half.
55,251 buildings. The 558 that appear in no age source are drawn as outlines and left uncoloured.
What to notice
The coral core is a single generation of building — an imperial spa town that went up between 1890 and 1910. Everything around it arrived later, and none of it replaced the core.
Source: Zensus 2022 · OpenStreetMap · Denkmalliste Hessen · Wiesbaden heat plan
Two ways to measure six eras
How to read
The palette runs warm to cool across a century and a half — not a heat map, but six distinct chapters in how Wiesbaden was built.
The same six eras, measured twice. Band A: width is the era’s share of every dated building. Band B: width is the number of years the era covers.
Colours match between the two bands, so each era can be traced from one to the other.
A · Width = share of all dated buildings
B · Width = years covered
What to notice
Before 1919 is the longest era and only the third largest. The concrete years are the shortest and the biggest. Age and duration are not the same measurement.
Source: Zensus 2022 · shares of 54,693 dated buildings
Six façades
How to read
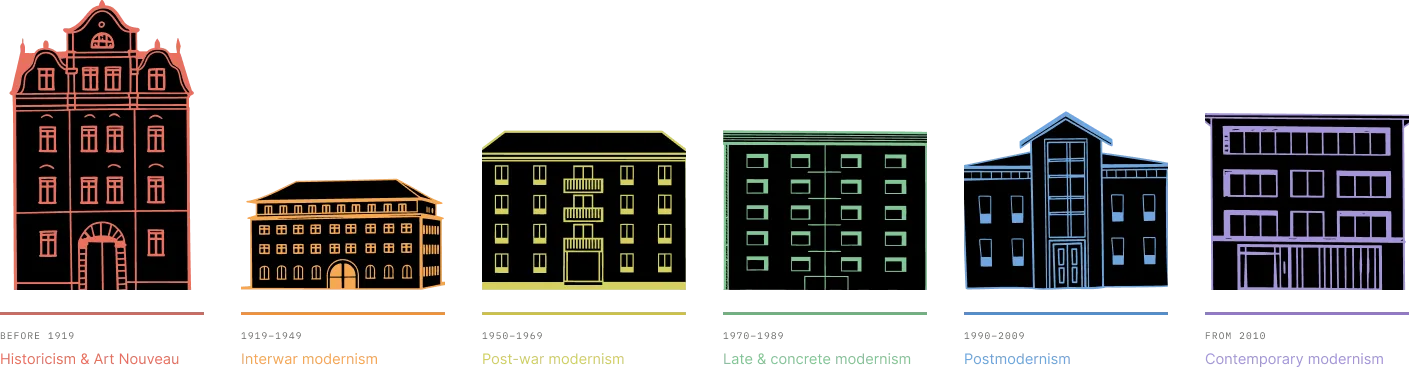
Each era carries a drawing taken from the real architecture of its period — not a generic building icon. The drawings live inside the interface: choose an era and its façade appears.
Style names follow the classification used in the map’s own legend.
What to notice
Ornament, then economy, then structure, then insulation — a century and a half of changing ideas about what a façade is for.
Watch the city arrive
How to read
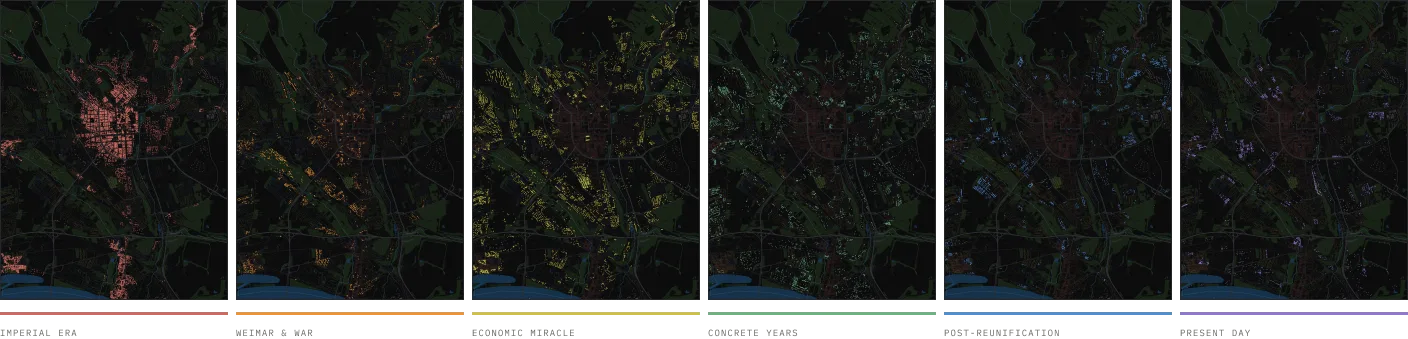
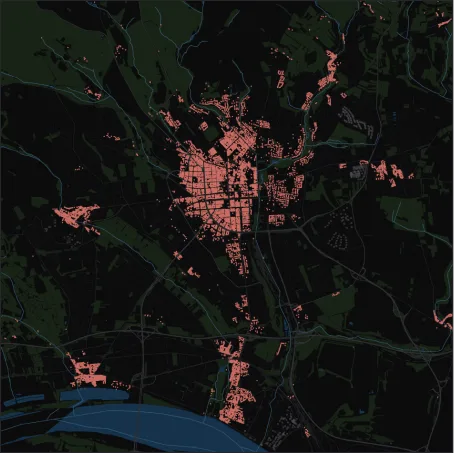
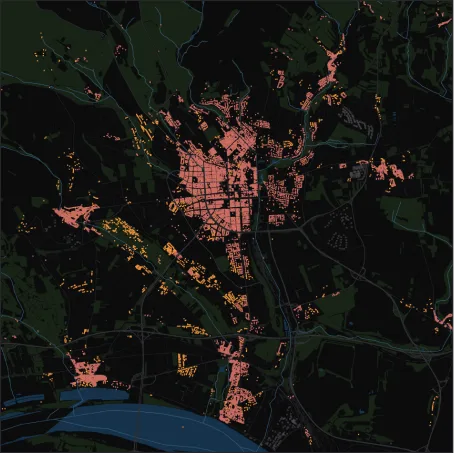
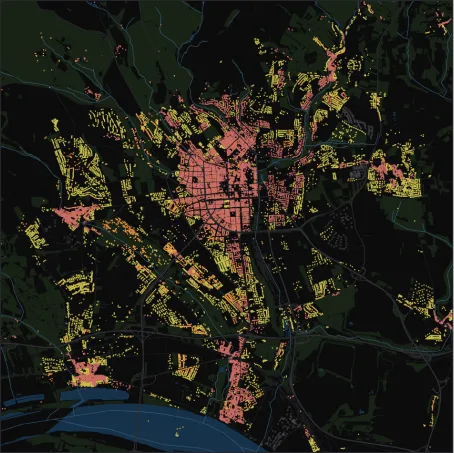
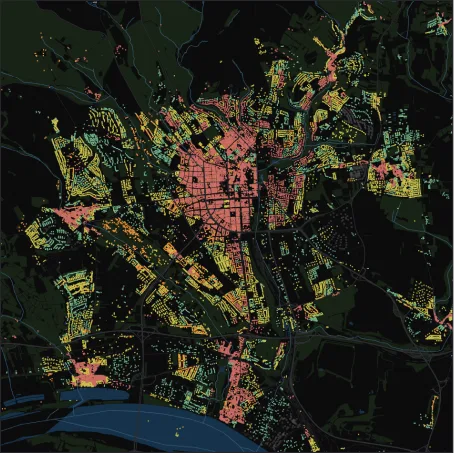
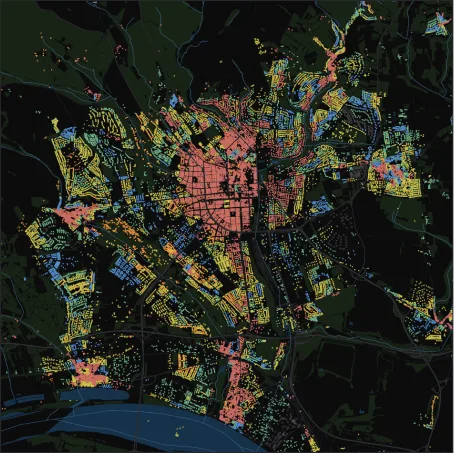
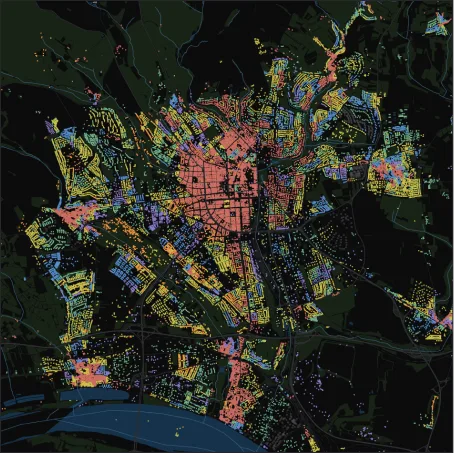
Six frames from the timelapse, one per era. Each frame keeps everything already built and adds the next band on top.
The running figure is the number of buildings standing at the end of that period.
What to notice
The city more than triples between 1950 and 1989. At no point is anything subtracted — that is the whole argument of the map.
Down to one building
How to read
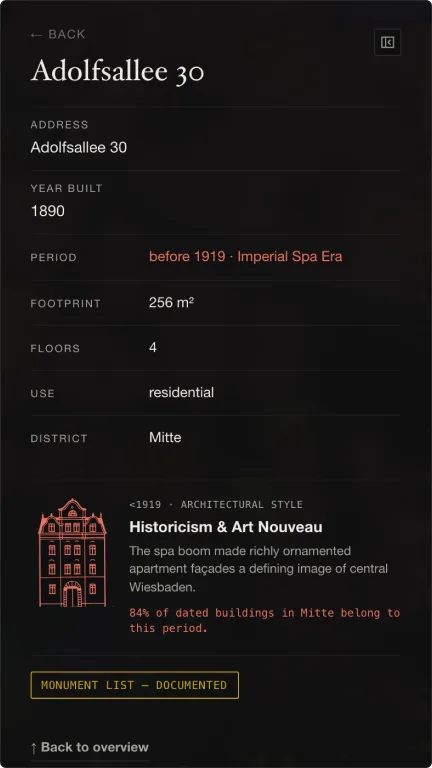
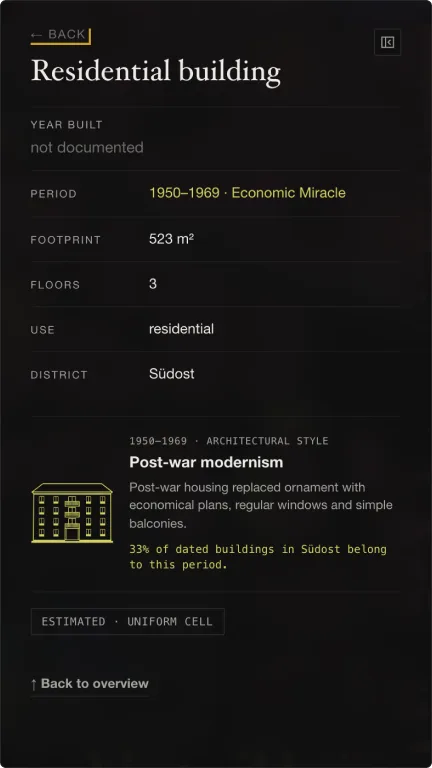
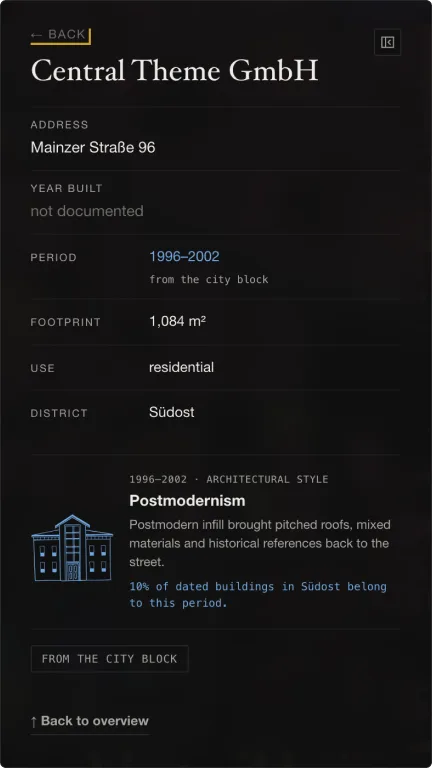
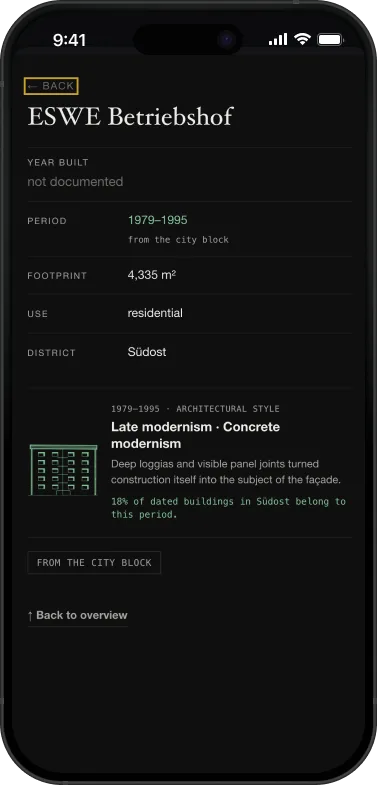
Tap any footprint and the map opens its card: address, year, period, size, storeys, use and district — plus the architectural style of its era and how common that era is in the surrounding district.
The card takes the colour of the building’s period, and the badge at the bottom names the source its date came from.
And all of it on a phone
How to read
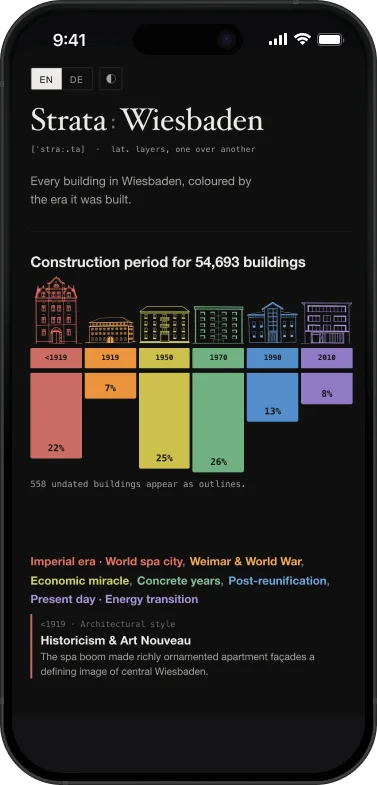
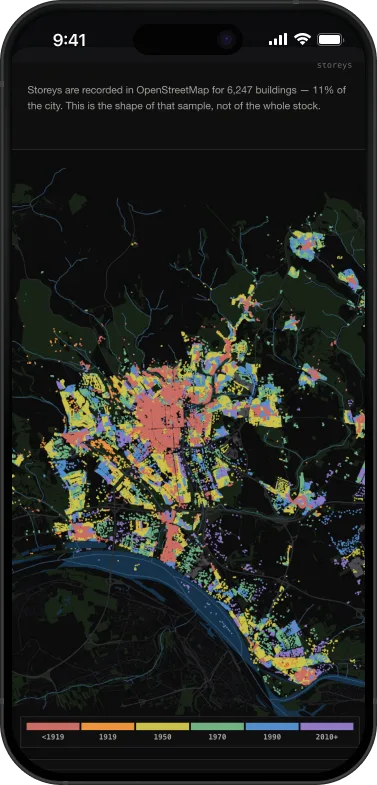
Data projects rarely survive the small screen. This one is the same document at 390 px — the era chart keeps its façade drawings, the map keeps its legend, and the building card opens as a full-screen sheet.
Sources and licences
- Footprints & attributes
- OpenStreetMap contributorsODbL
- Age of the housing stock
- Zensus 2022 · Statistische Ämter des Bundes und der LänderDL-DE / BY-2-0
- Block age classes
- Landeshauptstadt Wiesbaden · Tiefbau- und Vermessungsamt, municipal heat planWFS geoportal.wiesbaden.de
- Documented dates
- Denkmalliste Hessen · Landesamt für Denkmalpflege · WikidataAttribution
Even the mark is built from the data: the area of each ribbon inside the circle is that era’s share of the city.